Pearson’s Chi-Squared Test with Python
May 17, 2018
2 min read


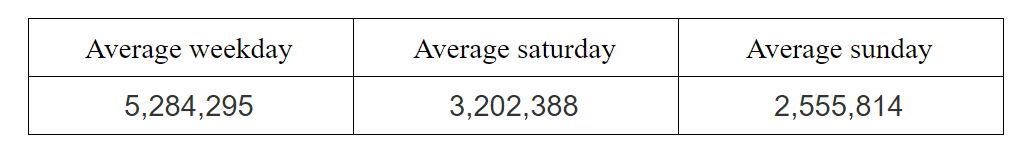
Pearson’s chi-squared test is a statistical test applied to sets of categorical data to evaluate how likely it is that any observed difference between the sets arose by chance. Categorical data is statistical data consisting of categorical variables(a variable that can take on one of the limited possible values). Example of categorical data will be subway usage on specific days:
In simple words, by using Pearson’s chi-squared test we can accept or reject the null hypothesis. Usually, a null hypothesis represented in the way of an expected set of data and alternative hypothesis as some newly observed data.
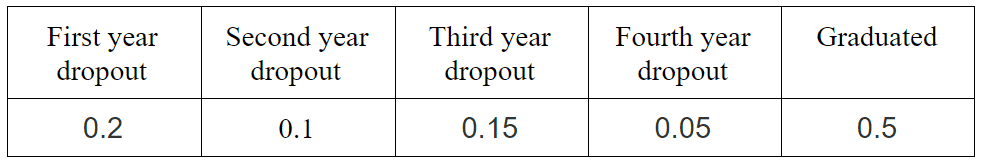
Let’s take a look at the example. We have data about students dropout/graduation rates(null hypothesis).
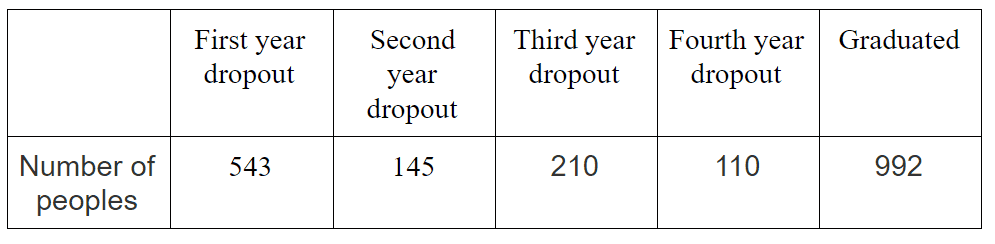
Recently we decided to make research on this topic and as a result, received this data:
Assuming the old data was correct what how would expected data look for given sample size?
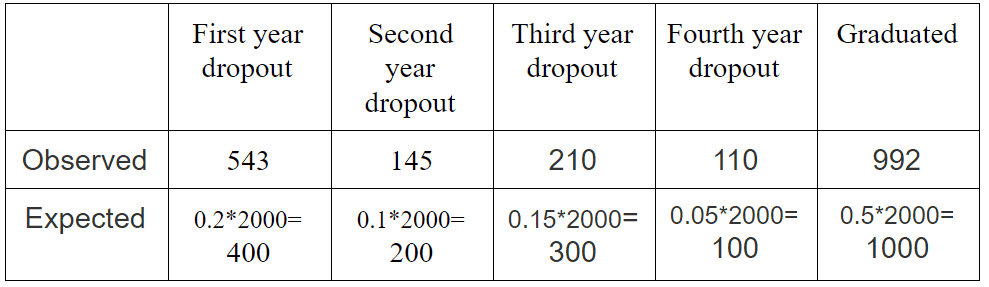
With this table in place we can calculate Chi-Square statistic using this formula:

def get_chi_square_statistic(observed, expected):
    return sum([((o - e)**2)/e for o, e in zip(observed, expected)])

observed = [543, 145, 210, 110, 992]
expected = [400, 200, 300, 100, 1000]

chi_square_statistic = get_chi_square_statistic(observed, expected)
# 94.3115
Now, when we have Chi-square statistic it is the right time to accept or reject the null hypothesis. But first, we need to choose significance level. The most common choice for significance level is 0.05, so we will use it in our example.
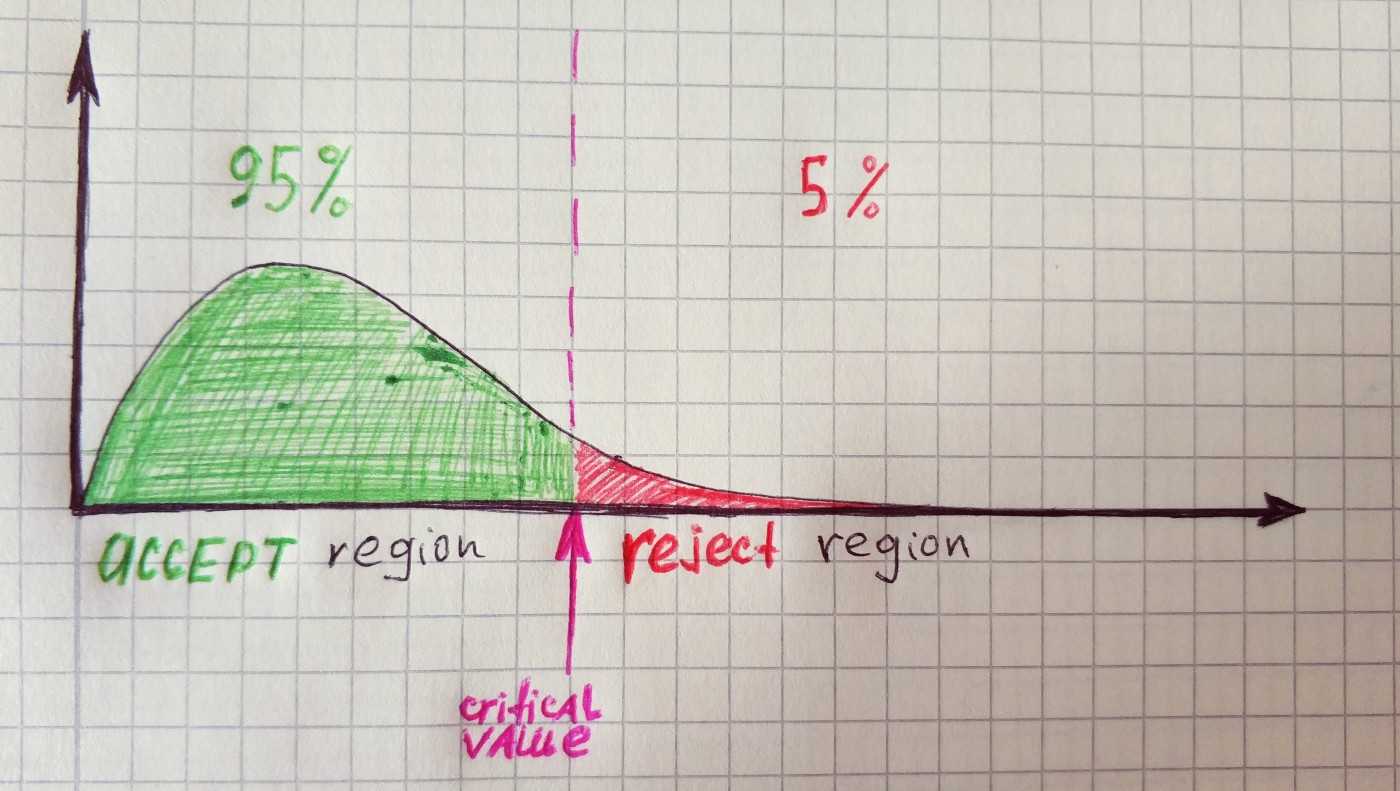
As you might guess we will use Chi-squared distribution function. The degree of freedom for distribution in Pearson test equal to n-1, where n is the number of categories. In our example, there are 5 categories, therefore the degree of freedom equal to 4.
As you can see our value is much larger than the critical value, therefore, we will reject the null hypothesis.